
Monitoring that answers questions
A wall of dashboards is not observability. Useful monitoring starts from the questions someone needs answered while the system is misbehaving.
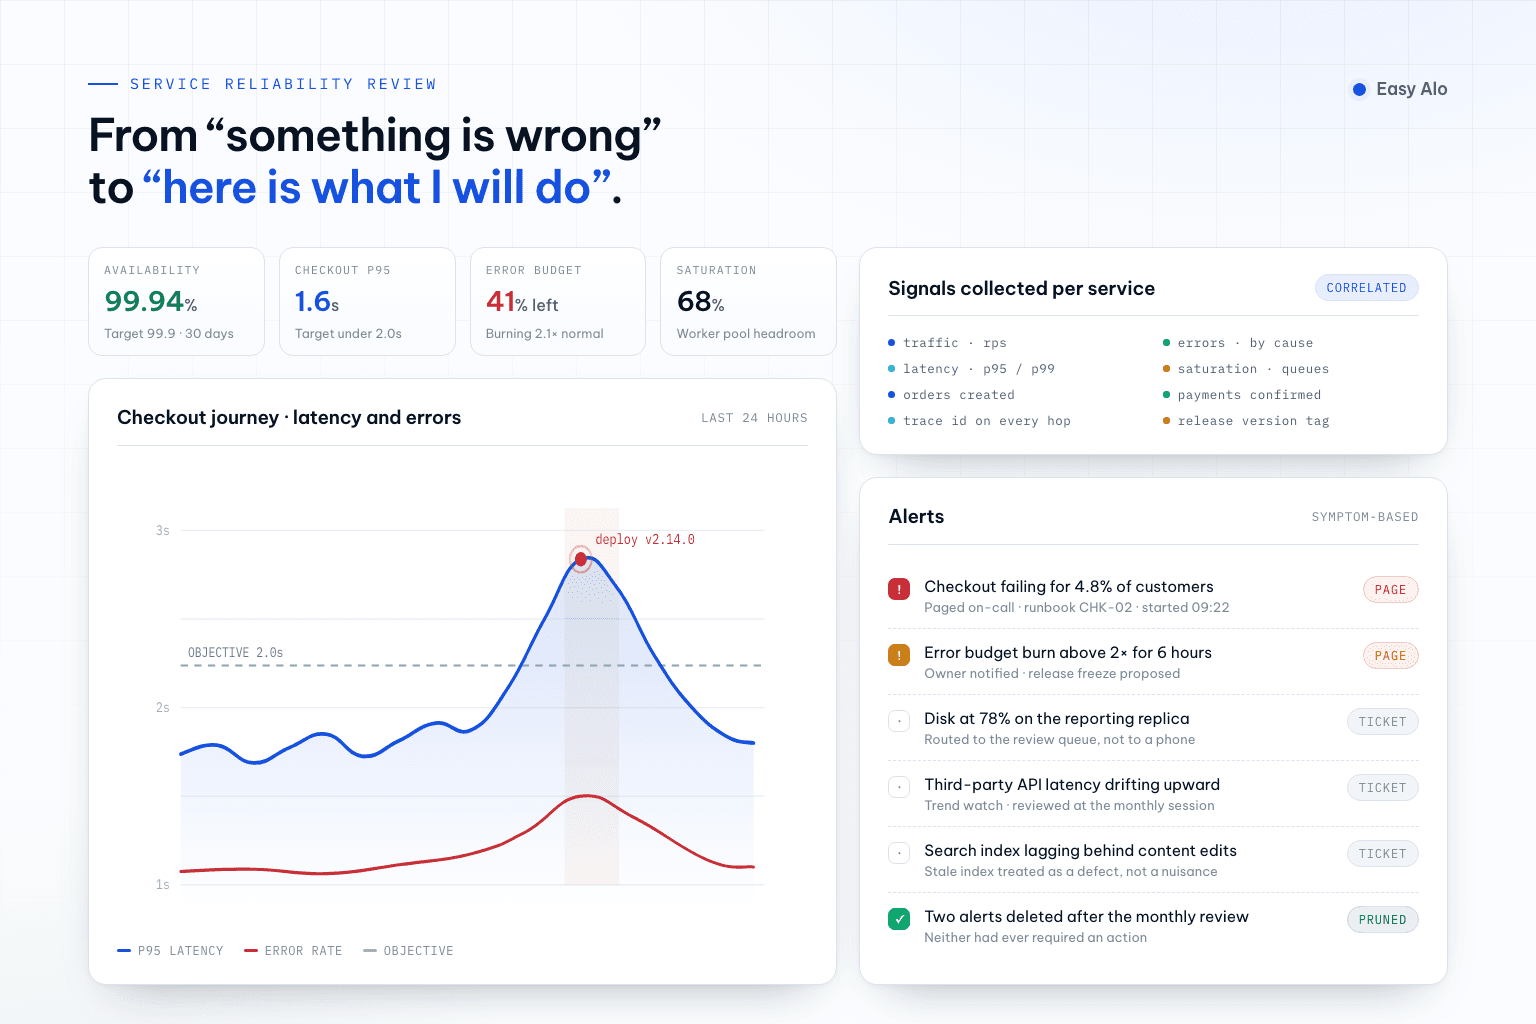
Most monitoring setups grow by accumulation. Someone adds a dashboard after an incident, someone else adds an alert, and a year later the team has hundreds of graphs, dozens of notifications and still cannot say whether the system is currently healthy.
The problem is rarely a missing tool. It is that the data was collected before anyone decided which questions it should answer, and who would be woken up when the answer is bad.
1. Start from the questions, not the dashboards
Write down what the team actually needs to know, in the order the questions get asked. Is the service working for users right now? If not, which part and since when? Is this caused by our last release, by traffic, or by a dependency? Is it getting worse? Which action would help?
Each question implies a specific signal and a specific view. That is a far better design brief than “set up monitoring”, and it makes it obvious which of the existing graphs nobody has ever used to make a decision.
- Is the user-facing journey working, measured the way a user experiences it?
- Which component or dependency degraded, and when did it start?
- Did this begin with a deployment, a configuration change or a traffic shift?
- How much of the error budget or capacity headroom is left?
- What is the safest immediate action: roll back, scale, disable a feature or wait?
A dashboard that nobody has used to make a decision in three months is not a safety net. It is background noise that makes the useful panels harder to find.
2. Measure what the user feels before what the server reports
CPU and memory describe how a machine is coping, not whether a customer can place an order. Start instead from the request path: how many requests fail, how slow the slow ones are, how much work is arriving and how full the system is. Those four signals cover most first questions.
Then turn the important journeys into indicators with a target. “Checkout submissions succeed in under two seconds for 99% of requests over 30 days” is a sentence a business owner and an engineer can both hold. It also gives the team a budget: how much failure is acceptable before feature work pauses in favour of reliability work.
- Traffic: request rate per endpoint and per client type, so anomalies have context.
- Errors: failure rate split by cause, separating client faults from server faults.
- Latency: measured at the 95th and 99th percentile, never as an average.
- Saturation: queue depth, connection pools, disk and worker capacity.
- Business events: orders created, payments confirmed, messages delivered — the outcomes the system exists for.
3. Logs, metrics and traces do different jobs
These three are often treated as interchangeable, and the result is a system that stores a great deal and explains very little. Metrics are cheap to keep and good at showing that something changed. Logs carry the detail of one event. Traces show how one request moved across services and where its time went.
The value comes from being able to move between them. A latency alert should lead to the traces of the slow requests, and a trace should lead to the logs of the failing step. That only works if requests carry a correlation identifier from the first hop, and if every signal is tagged with the same service, environment and version.
- Metrics: low cardinality, long retention, used for alerting and trend analysis.
- Logs: structured as fields rather than sentences, so they can be filtered rather than read.
- Traces: sampled, with the slow and failing requests kept deliberately rather than at random.
- Shared context: request identifier, service name, environment, release version and tenant on every signal.
- Retention set by usefulness and cost, decided once rather than defaulting to forever.
If diagnosing an incident requires SSH access to a server, the observability work is not finished — and the people who most need the answer usually do not have that access.
4. Alert on symptoms, page only for what needs a person
An alert has one job: to bring a human to a problem they can act on. Anything that fires without a required action trains the team to ignore the channel, and a channel that gets ignored fails silently exactly when it matters.
The practical rule is to page on symptoms the user would notice, and to route causes to a place that gets reviewed rather than a phone. Disk filling at 3am is a ticket. Checkout failing for 5% of customers is a page. Every page should link to a short runbook that names the likely causes and the first checks.
- Every paging alert states the user impact, not just the metric that crossed a line.
- Every paging alert has an owner, a runbook and a defined next step.
- Warnings and capacity trends go to a review queue, not to an on-call phone.
- Alert on a sustained condition over a window, so a single spike does not wake anyone.
- Track how often alerts turn out to be actionable, and delete the ones that never are.
5. Give monitoring an owner and a rhythm
Monitoring decays because systems change faster than their instrumentation. A new service ships without metrics, a renamed field breaks a dashboard, a threshold set for last year's traffic fires constantly. Without a review rhythm, the team discovers all of this during an incident.
Treat instrumentation as part of the definition of done for any feature that carries risk, and hold a short monthly review of what fired, what was useful and what should change. After each real incident, ask whether the monitoring told the story or whether someone had to guess — that answer is usually the most valuable output of the review.
- New services ship with the standard signals, dashboards and alerts on day one.
- Dashboards and alerts are reviewed monthly and pruned without ceremony.
- Every incident review asks what would have detected this sooner.
- Thresholds are revisited when traffic patterns change materially.
- One named owner is accountable for the monitoring of each service.
The goal is not more visibility. It is that whoever is on call can go from “something is wrong” to “here is what I will do” without help — and that the team notices problems before customers report them.
Monitoring checklist for a production service
- The critical user journeys are named, with an indicator and target for each.
- Traffic, errors, latency percentiles and saturation are collected per service.
- Business outcomes are measured alongside technical signals.
- Logs are structured, and a request identifier links logs, metrics and traces.
- Every signal is tagged with service, environment and release version.
- Paging alerts describe user impact and link to a runbook with an owner.
- Non-urgent findings go to a review queue rather than an on-call channel.
- Dashboards and alerts have a monthly review, and incidents feed back into them.